/ Findings
Top Performance Killers
Which findings arise more often and which have the highest impact on the performance?
The following chart shows the top 11 findings detected on site having a negative impact on the performance of the analyzed PV plants. The number attached to each bar shows in how many PV plants each finding was present.
It can be seen how heavy soling and near shading, two findings linked to the design constraints of the site, appear in a significant amount of PV plants, while inactive cell strings and mechanical damages in cells, both related to the electromechanical integrity of the modules, are present in around 7% and 30% of the inspected plants, respectively. The findings (i) strong deviation from true South, (ii) self- shading and (iii) the inconsistent tilt angle, belong to the third level and all of them are related to an inadequate design of the PV plants. Finally, Underperformance, i.e., Potential Induced Degradation (PID), disconnected circuits and inverter clipping represent a mix of findings related to (i) an inadequate design of the electrical architecture of the DC part, (ii) failures in the installation and (iii) unexpected module degradation mechanisms.
Another aspect that also contributes to the loss of energy production is an operation and maintenance plan below market standards. Specifically, the lack of spare parts on site coupled with high reaction times, are two aspects that directly result in loss of availability and therefore in a drop of the yield. Only a handful of the PV plants had spare parts on-site or nearby, and in most of them there was no written agreement setting the contractual reaction times. In regard to the extremely low specific yields recorded in some of the PV plants, it is important to consider that although in some of them less nominal power was installed than initially planned, the calculation of the specific yield is carried out with the latter. This undoubtedly leads to unfairly low performance indicators. The following graph shows which of the findings shown previously have the highest impact on the performance of the inspected PV plants. The graph also indicates the maximum energy loss values associated to each of these findings. The graph below shows how an advanced stage of Potential Induced Degradation (PID) can lead to a loss of global production at the PV plant level of almost 60%.
The graph below shows how an advanced stage of Potential Induced Degradation (PID) can lead to a loss of global production at the PV plant level of almost 60%.
It is important to bear in mind that in some cases, Potential Induce degradation has been reached in only one year. This phenomenon can be explained by the high sensitivity of the modules and the typical hot and humid conditions in the region. On the other hand, the presence of bird droppings, debris or pollution, result in soiling losses of up to 20% in some of the PV plants. In this regard, it is important to bear in mind that in some of the PV plants visited by MCIND and Aerocompact underwent a natural cleaning a few days before through heavy rainstorms and hail. These events likely removed much of the accumulated dirt on the modules. The values measured on site by MCIND can therefore be greatly exceeded during the dry season. The losses caused by near shading and strong deviation from true South are estimated in some of the inspected PV plants at around 8% and 9% respectively.
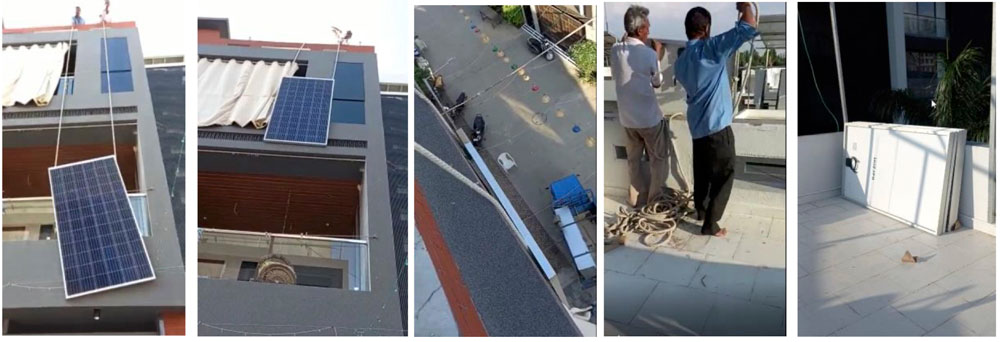
These losses are difficult to mitigate since they are due to design constraints which should have been properly addressed during the design phase. Finally, the losses associated to mechanical damage of cells, as well as inactive cell strings induced by soiling, shading or cracks, could reduce the production of some PV plants in a range of 6-10%. These losses are often caused by transportation malpractices, mishandling of Modules during the installation and O&M phase, and eventually due to product failures. For the latter, the cooperation of the manufacturers regarding the supply of replacement modules should be motivated. Since in most of the analyzed cases the warranties offered by the installation companies are limited to the product and do not include workmanship, the damages resulting from mishandling during installation remain uncovered. The present study includes a deeper analysis of the module transportation, handling and installation practices and how these could affect the long-term performance of the PV plants.

Description of Findings
Underperformance
59%
prevalence
15.4%
average loss
65.7%
max loss
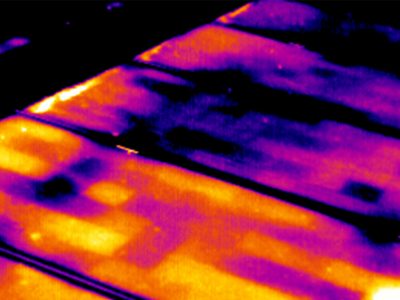
Underperformance can be a result of different situations such as advanced degradations rates, i.e., advance cell cracking, accelerated Potential Induced degradation (PID) rates, as well as lack of manufacturing quality issues.
More
Deviation from South
29%
prevalence
1.7%
average loss
9.10%
max loss
In some of the inspected plants, the PV modules were installed parallel to the facades despite the building’s strong deviation towards South-East or South-West. Thus, when aligned with the building, the PV modules’ orientation is significantly deviated from the optimum.
More
Inverter clipping
1%
prevalence
3%
average loss
3%
max loss
Inverters are designed to operate at certain ranges of DC and AC voltages. In cases when the amount of modules in series or the DC/AC overbuilt are not properly selected, disruptions may occur.
More
Disconnected circuits
7%
prevalence
14.4%
average loss
46.6%
max loss
One of the characteristics of the series connection of modules is that if one element of the circuit is in open circuit, then the whole circuit is off. As a consequence, no current is produced and production losses occur.
More
Inhomogeneous tilt angle
32%
prevalence
1.6%
average loss
5.4%
max loss
The energy production of a PV panel is proportional to the solar irradiation it receives, and the latter obviously changes depending on the tilt angle of the PV panel.
More
Self Shading
54%
prevalence
3.3%
average loss
12.9%
max loss
Shadow cast by PV modules onto other PV modules should be minimized in order to prevent energy production losses and hotspots development.
More
Near Shading
85%
prevalence
3.2%
average loss
15%
max loss
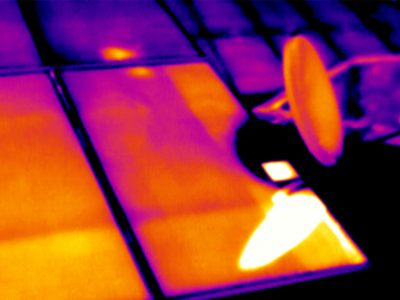
This type of shading is caused both by objects inside the PV plant and along the perimeter of the building area. For the former category, examples are walls on the roof of the building, antennas and water tanks.
More
Heavy Soiling
90%
prevalence
7%
average loss
28%
max loss
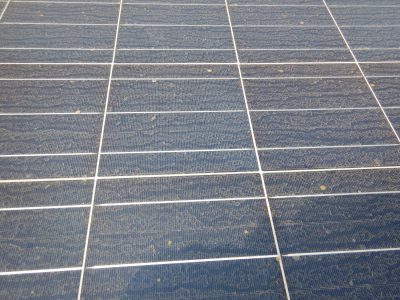
Dirt and particles can accumulate on the PV module’s front glass over time. Depending on the environmental conditions, PV plants need different cleaning frequencies.
More
Cell Cracks
74%
prevalence
5.5%
average loss
12%
max loss
Photovoltaic cells are made of silicon. This makes the cells very fragile. Cell cracks are cracks in the silicon substrate of the photovoltaic cells that often cannot be seen by the naked eye.
More
Inactive Cell Strings
5%
prevalence
4.6%
average loss
6%
max loss
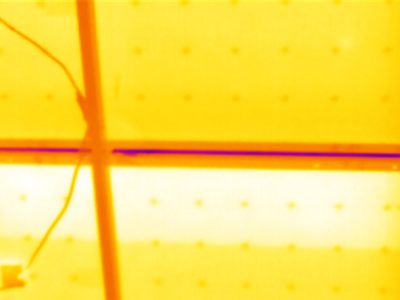
In parallel to a certain number of solar cells, bypass diodes are integrated into the PV module. These bypass diodes reduce the power loss caused by partial shading on the PV module.
More
Potential Induced Degradation
13%
prevalence
17.3%
average loss
56%
max loss
The phenomenon of Potential-Induced Degradation (PID) is based on a power loss degradation caused by a negative potential of the solar cells towards earth, which leads to an accumulation of Na+ located in the glass and migrating into the solar cells damaging the p-n junction responsible for the electron flow.
More
/ Findings
Module transportation and handling issues
Quality Assessment of PV Modules and Structure

According to different logistic providers for PV modules, 15M+ solar modules are broken every year prior installation. PV Module damages are often due to shipping on fragile wood pallets and boxes with partial loads. Module handling, transport and installation require minimal understanding of the PV technology.

Even though these issues are known within the industry, mechanical effects in the modules, i.e., cracks, scratches, broken glass, are still a nuisance in project development, especially during transportation (Factory – distribution center – project site – mounting structure). New technologies have also brought new sources of cracking, (interconnect ribbons for 9+ Busbars (CEA), manual solar cell soldering, lamination for certain EVA films with weak moisture impermeability). Furthermore, environmental aspects such as as snow loads, strong winds and hailstorms could induce major cracks on the modules’ surface.

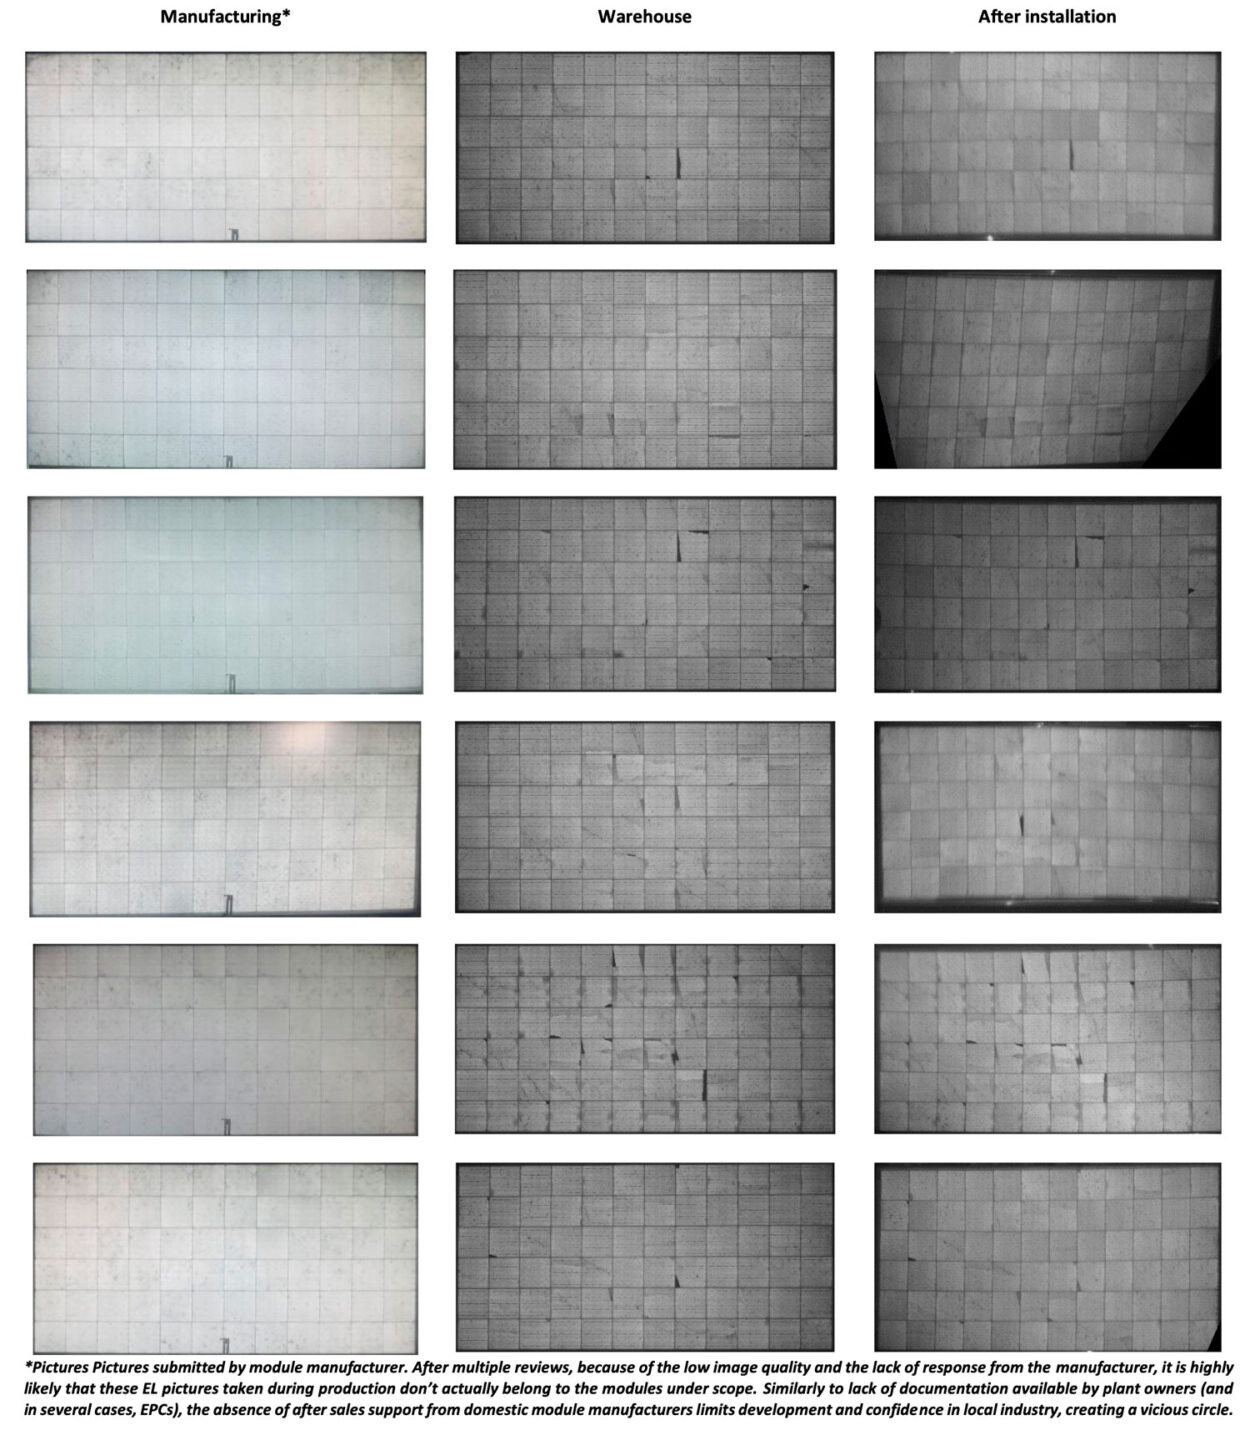
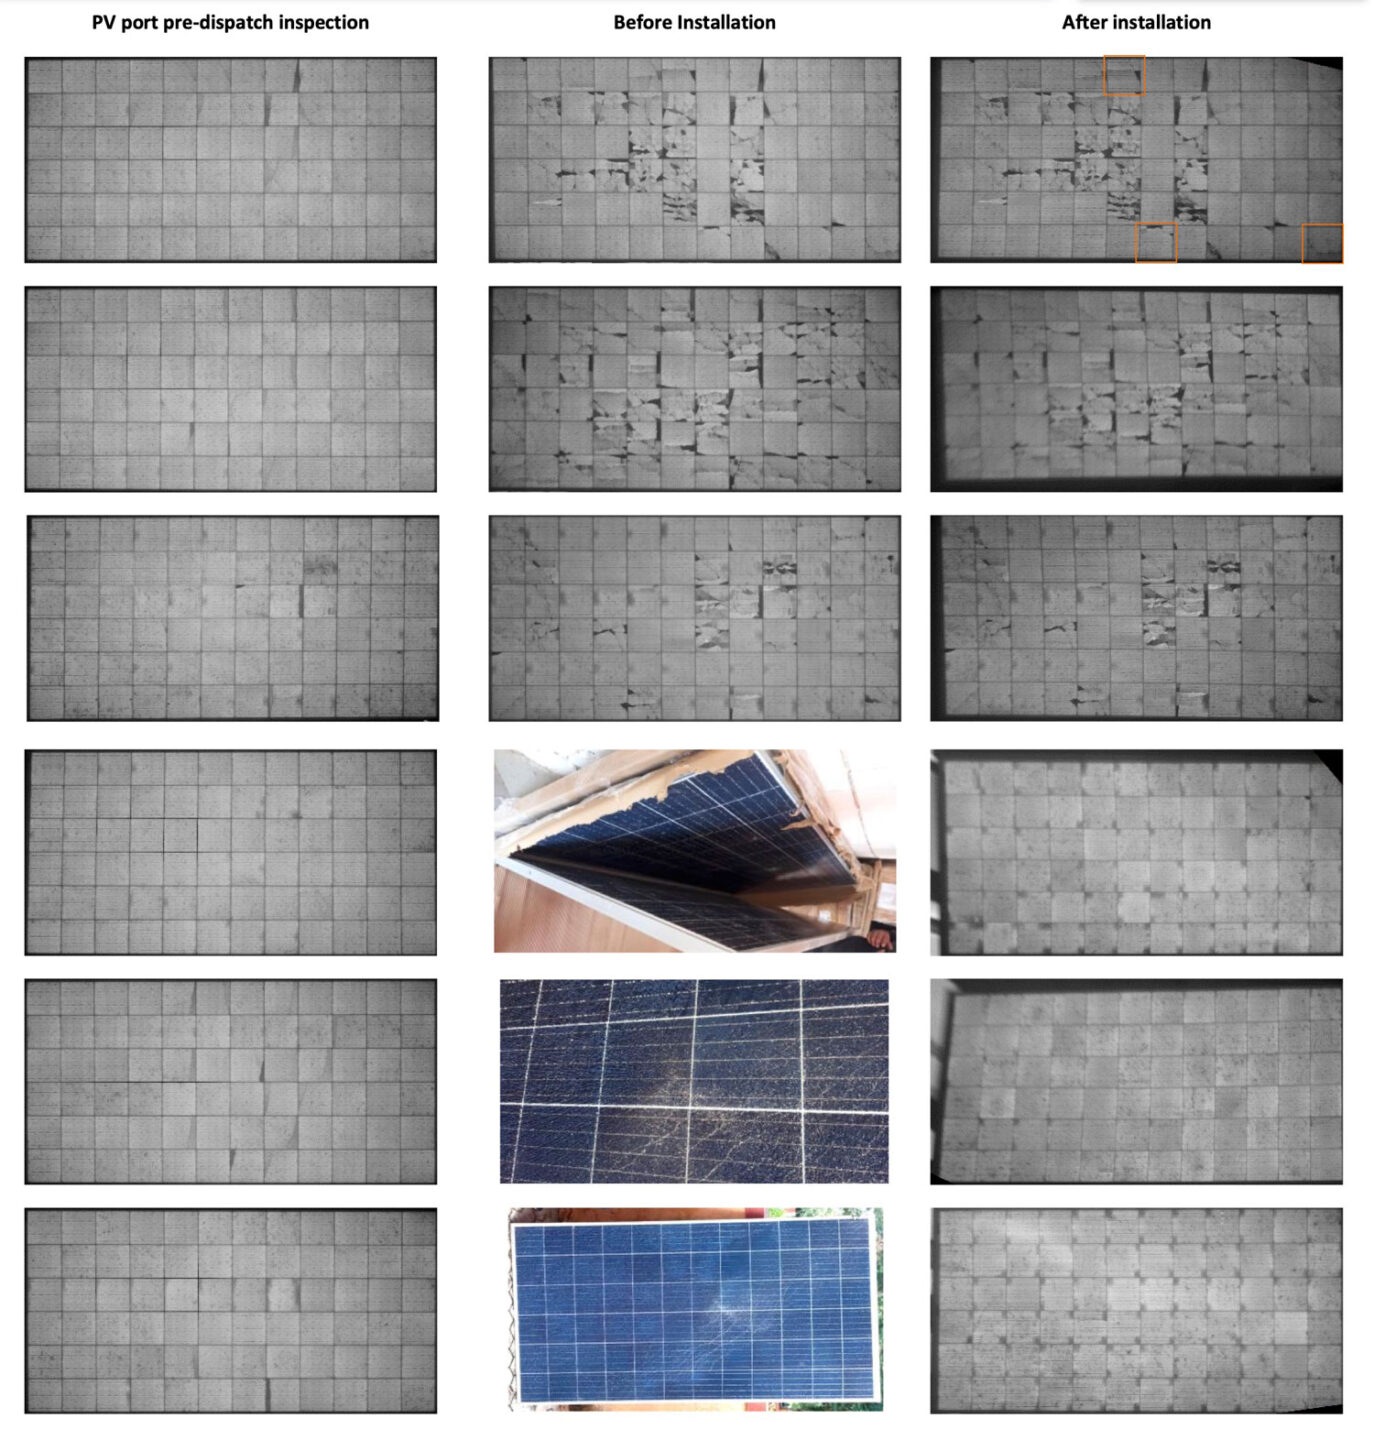
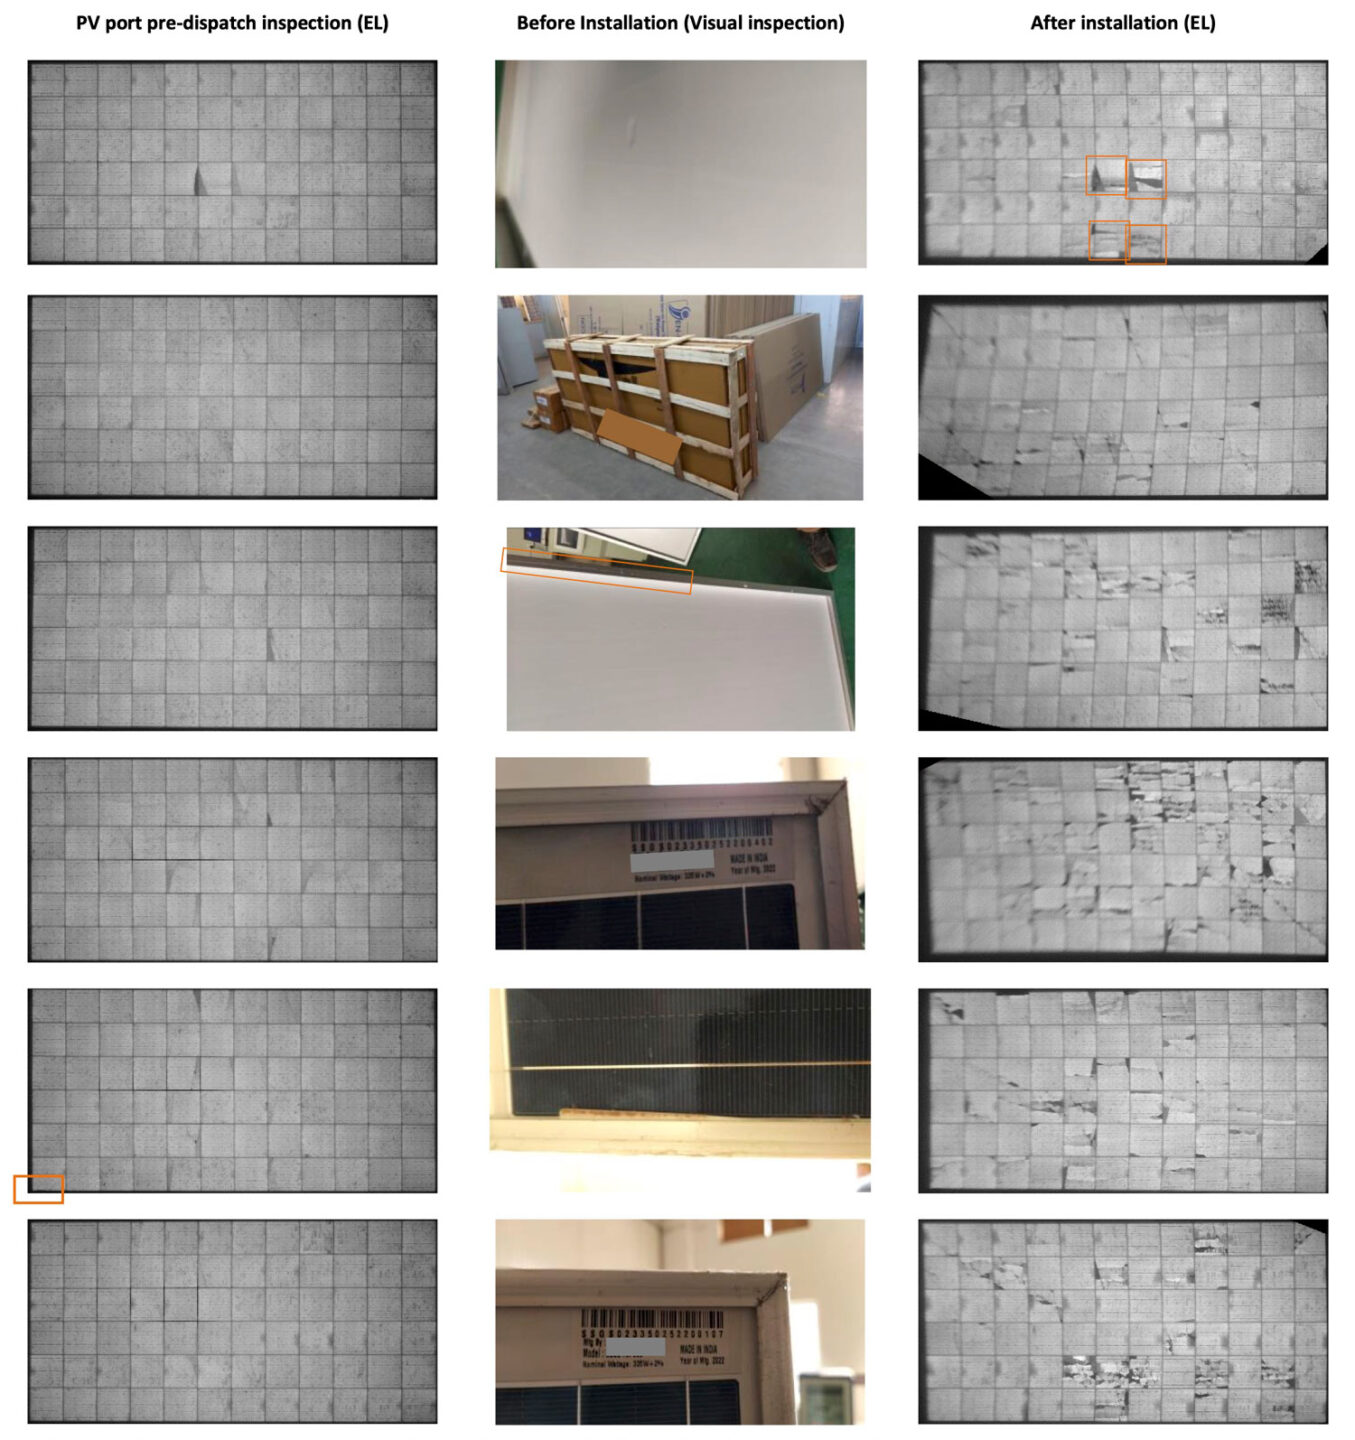
The majority of micro-cracks occurred in the range of low resonance frequency during road transportation (L. Chang, et al): diagonal cracks, parallel to busbars crack, perpendicular to busbars crack and branched cracks. Branched cracks are more likely to produce underperformance in the mid term when the cracked areas become isolated.

Statistical distribution of cracks, a) transportation, b) installation, c) example of both

The PV modules are the core of a solar photovoltaic system. Hence, for the assurance of the Module quality of a PV plant, the best practices suggest performing in-factory supervision of production while PV modules are being manufactured. This includes experienced Quality Engineers deployed in the factory during production. The Engineers will supervise production to ensure that all required material, process and production controls are applied – and applied correctly.

When this process cannot be implemented or is not part of the scope or a Project, there are a few mitigation measures to uncover possible risks on an early stage of the projects. These are the so-called Pre-shipment Inspection, Post-Shipment Inspection (PSI) and Inspection During Installation procedures.

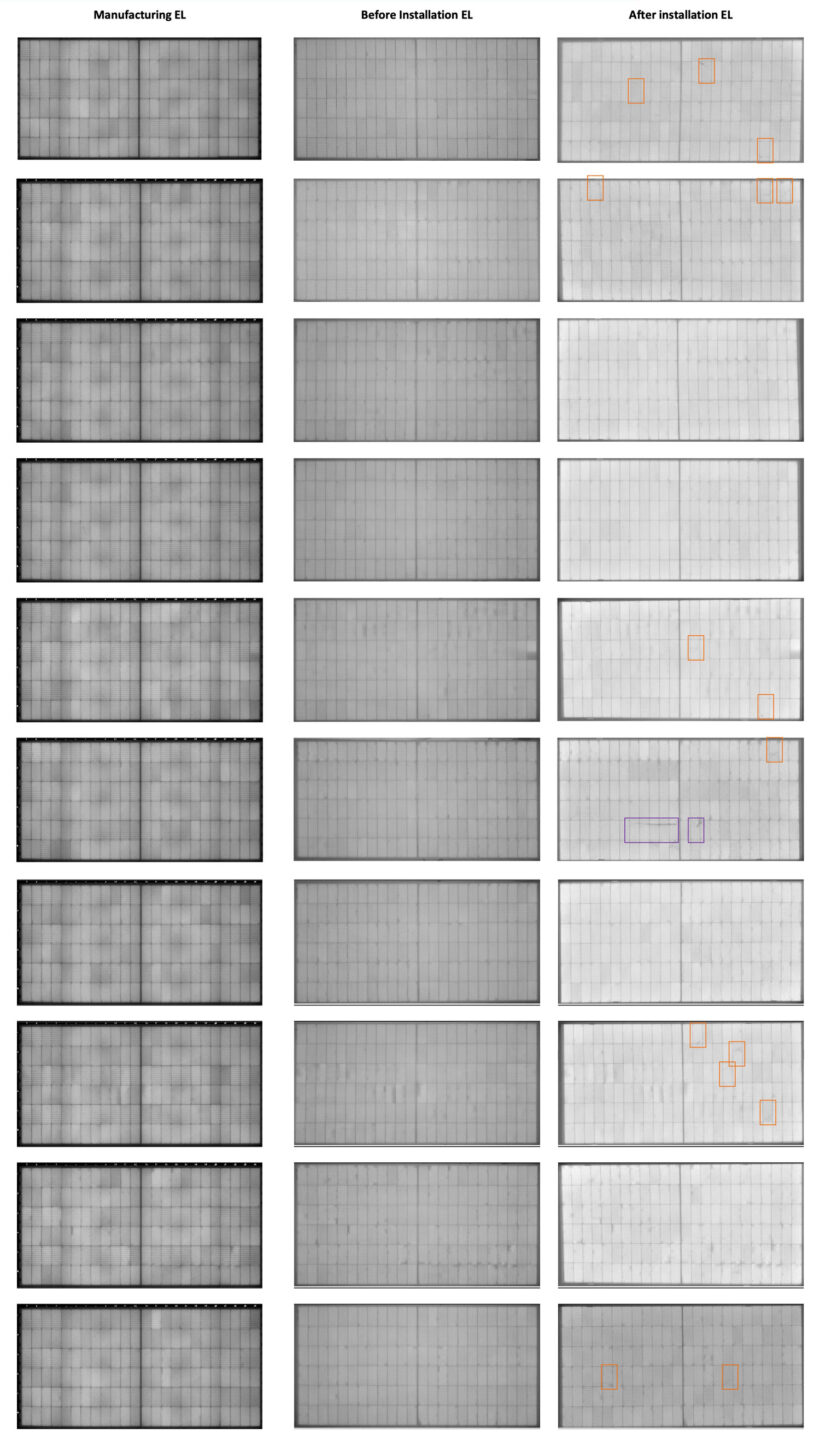
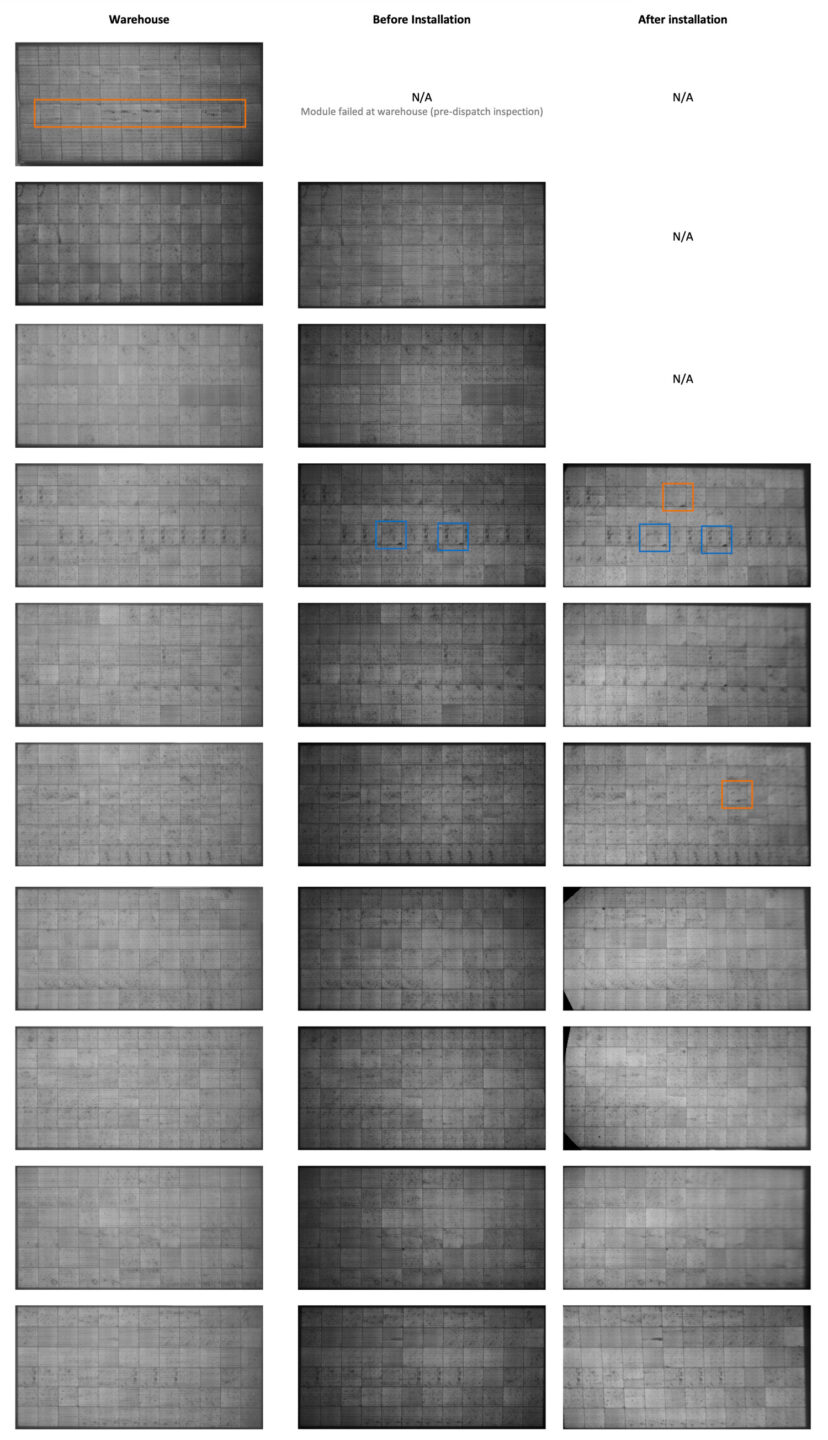
The Pre-shipment inspection is normally carried out on a sample basis and used to release modules for shipment (Manufacturing facility). During the Post-Shipment Inspection, a sample of modules is normally tested prior installation. Upon delivery of the modules to the Project site, and prior to the installation of the modules, Visual inspection (VI) and Electroluminescence (EL) imaging are performed once again. Here, the defect criteria defined in the supply agreement will be used (when available). During installation, the technical advisor will provide oversight of the installation of the modules and testing on a quantity of installed modules (VI and EL) and mounting structure (VI) to verify the quality of the installation work, including but not limited to: PV Module Handling & Storage and PV Module Mounting (EPC, different crews). Quality criteria as defined in the purchase is normally used, unless specified otherwise.

For the sites for logistics assessment, the main reporting should be focus on the evolution of the VI and EL failures in the modules from manufacturing, at warehouse (Intermediate delivery), upon arrival and after installation in a way that the 4 pictures evaluated are displayed so it is clear where the modules suffered most of the damages, i.e., Manufacturer/Warehouse – On-site delivery – After installation.

The purpose of this evaluation is to describe a common acceptance criterion for the Electroluminescence analysis (PI Berlin) for Poly-crystalline and mono-crystalline PV modules. PV Modules with critical defects are to be replaced after inspection by the owner/constructor, according to contractual criteria (with replacement modules being inspected under the same criteria).

Figure 18: Cracks: branched, broken small, crack cross, crack perpendicular, scratch, broken multiple (PI Berlin)

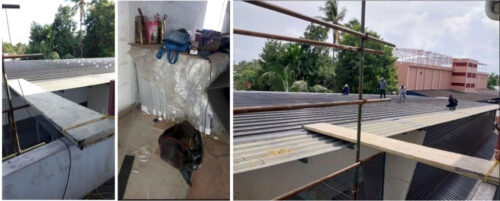
Then, a more superficial evaluation of the sites in general (mounting structure, cabling, shadings, etc.) was performed.

Logistics Sites

Site 1
Health:
Site 2
Health:
Site 3
Health:
Site 4
Health:
Site 5
Health: