Site 2.49
Site ID
2.49
Health

COD
2017
Nominal Capacity
500 kWp
Average Specific Yield
840 kWh/kWp
Total Estimated Loss
47.24%
Possible Gain
11% to 35%
CAPEX, OPEX
0.72 ₹/Wp, 0.19 ₹/Wp/a
Expenditure / Energy
2.6 ₹/kWh to 0.8 ₹/kWh
Abstract
Cables and connectors observed to be degraded. One inverter found to be non- operational. It is recommended to (i) improve cleaning activity, (ii) replace faulty components and restore inverter functionality (iii) add earthing connections, (iv) replace damaged modules, (v) retrofit the mounting structure, (vi) re-sort modules, and (vii) install a weather station or at least an irradiation sensor on the module plane. The estimated production boost expected by the retrofitting actions lies between 10.5% and 35%.
Main Findings
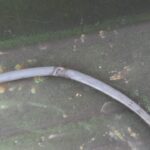
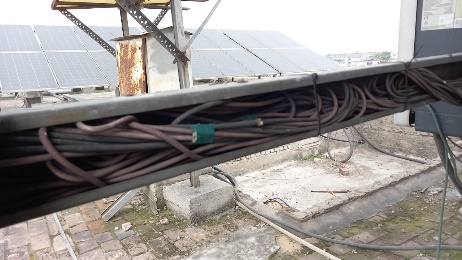
Cable management: Cables with low bending radius. Cables with cuts and abrasions found. Degraded connectors and cables.
Inverter fans and filters soiled.
Some inverters are not grounded.
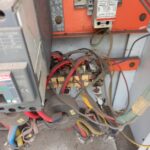
One inverter non-functional due to burnt wire in mains.
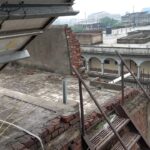
Improper roof access to some roofs and missing safety rails in the installation area.
Some earthing strips between structures are disconnected or loose.
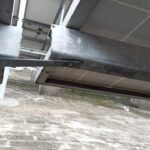
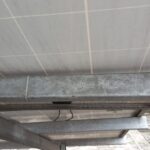
Module misalignment due to bent and damaged purlins and posts in the structure. Sharp structure edges not secured. Clamps improperly installed on sheet roof installations.
Modules of different power classes connected to the same string.
No weather station found on site.
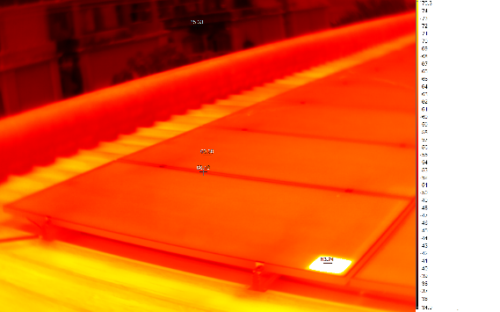
IR analysis reveals hot cells from soiling on modules from Block B.
Impact on Performance
Heavy Soiling
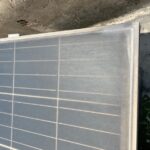
The system performance was affected by soiling loss of 7.8%, estimated from IV curve measurements. Modules on Block B are severely soiled due to nearby industries. IR analysis reveals hot cells from soiling on modules from Block B.
Estimated Loss
≈ 7.8%
Near Shading
Modules shaded by iron rods in front. According to PVsyst simulation, the near shading losses account to 1.67%.
Estimated Loss
≈ 1.67%
Self Shading
Some modules are shaded by adjacent tables with different heights.
Estimated Loss
≈ 1.77%
Cell Cracks
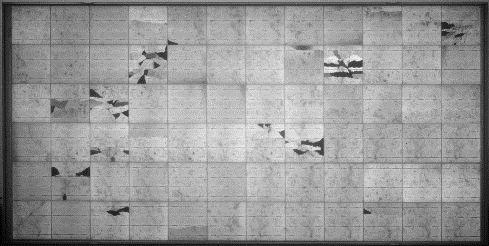
The EL image reveals presence of cracks and isolated parts. These defects are expected to impact performance and generate hotspots.
Estimated Loss
≈ 8%
Underperformance
Based on the IV curve measurements, the estimated underperformance is 28% for the measured modules.
Estimated Loss
≈ 28%
Total Estimated Energy Loss
≈ 47.24%
Proposed Solutions
The cable layout can be optimized; the minimum cable bending radius is 10x the cable diameter. Cables with cuts shall be replaced due to safety concerns.
The cleaning cycles shall be increased based on the results of the soiling study.
Inverter fans and filters shall be cleaned more frequently.
Inverters shall be grounded. Faulty components in mains shall be replaced to restore inverter generation.
A better roof access and safety railings shall be provided for safer O&M activity.
Earthing connections between mounting structures shall be redone.
Improperly installed clamps on sheet roof and damaged structure components shall be replaced to restore structure functionality and reduce module misalignment.
A re-sorting shall be conducted to have modules with same power class, and lower performing modules in the same string, or at least the same MPPT dedicated for each case.
Iron rods shall be relocated and tables shall have same heights.
A weather station, or at least an irradiation sensor on the module plane shall be installed.


